












25 Numbers That Show How Much Retirees Spend Per Month
A grocery receipt meets the 2022 spending averages for older households, with a separate 2024 figure for all ages.
By Linda Cho, CFP®, Money Editor
Updated · 18 min read
The short answer: Households headed by someone age 65 or older spent an average of about $4,818 per month in 2022, according to the Bureau of Labor Statistics. Housing took about $1,697, transportation $681, healthcare $628, and food $609. Households headed by someone 75 or older averaged about $4,457 monthly. These are household averages, not a target for your budget.
- Written by our money editor
- Cited 7 sources
- How we review
You’re in the parked car with the grocery receipt on the passenger seat. The total is higher than you expected, and you haven’t bought dinner for the rest of the week. Before deciding you’ve spent too much, you need a fair comparison.
The numbers below come mostly from 2022 Bureau of Labor Statistics data for households headed by someone age 65 or older.
That describes an age group, not retirees alone. Your bills give you the answer that matters.
25How Much Retirees Spend Per Month Nationally

Start with about $4,818 a month. That’s the 2022 average for households headed by someone age 65 or older, or about $57,818 across the year.
The word *household* matters. This isn’t a per-person figure, and the age group includes people who still work. If you live alone, don’t treat $4,818 as an amount you’re supposed to spend.
You’ll also see a larger number from the Bureau of Labor Statistics: about $6,545 monthly for all U.S. consumer units in 2024. That figure covers all ages and a different year.
Keep it separate from the older-household average. For a closer comparison, look first at the largest part of the older group’s spending: housing.
24Average Monthly Housing Costs After 65
Housing averaged about $1,697 a month for households headed by someone 65 or older in 2022. Shelter alone averaged about $974 monthly in the BLS age table.
That gap matters when you’re looking at your own number. A payment for the place you live is only part of the housing picture in the survey. Don’t compare one line from your bank statement with the full national category and decide you’re over budget.
Start with what actually leaves your account for housing. If a bill arrives outside your usual monthly rhythm, set aside a share for each month. Then put your monthly total beside $1,697. A higher figure points to a question worth asking, not a verdict on how you’ve managed your money.
See more: 23 Reasons Staying Put Costs More Than People Admit →
23Average Monthly Healthcare Costs After 65

A health insurance payment is easy to spot. The other healthcare costs take more hunting. In 2022, households headed by someone 65 or older spent about $628 a month on healthcare, according to BLS. About $440 a month of that average went to health insurance.
If you compare only your insurance payment with $628, you’ll miss what you pay at the pharmacy or after a visit. Pull those transactions into the same category before you judge it.
You also don’t have to treat $628 as the correct amount. It’s what surveyed households spent on average, not what care should cost. If your figure runs higher, find the charge behind the difference. If it runs lower, check that you haven’t left an occasional bill outside the month you’re reviewing.
See more: 22 Medicare Enrollment Checks Before Next Year's Coverage Starts →
22Average Monthly Transportation Spending After 65

Transportation averaged about $681 a month in 2022 for households headed by someone 65 or older, according to the BLS age table. Does that sound high next to what you spend at the pump?
Car keys on the hook don’t tell you the full cost. Payments and repairs arrive separately, and they’re easy to leave out when you picture a “usual” month. Look back through the transportation charges in your own records. Spread bills that don’t arrive monthly across the months they cover.
Then compare the result with $681. If your total differs, find the charge responsible before deciding what it means. The number worth understanding is the one attached to your car, your trips, and your bills.
21Average Monthly Grocery and Dining Spending

One receipt is a poor measure of a month’s food spending. The 2022 BLS average for households headed by someone 65 or older was about $609 monthly. Of that, about $400 went to food at home and $209 to food away from home.
Keep two running totals. Put groceries in one and meals out in the other. A restaurant charge that felt large on Tuesday looks different when you see the whole month beside it.
If your food total is above $609, the split shows where to look. If it’s below, you’ll know that without having to defend a single meal. Neither figure is a suggested allowance. It describes what the surveyed households spent, not what you ought to put in your cart.
20Average Monthly Utilities And Public Services
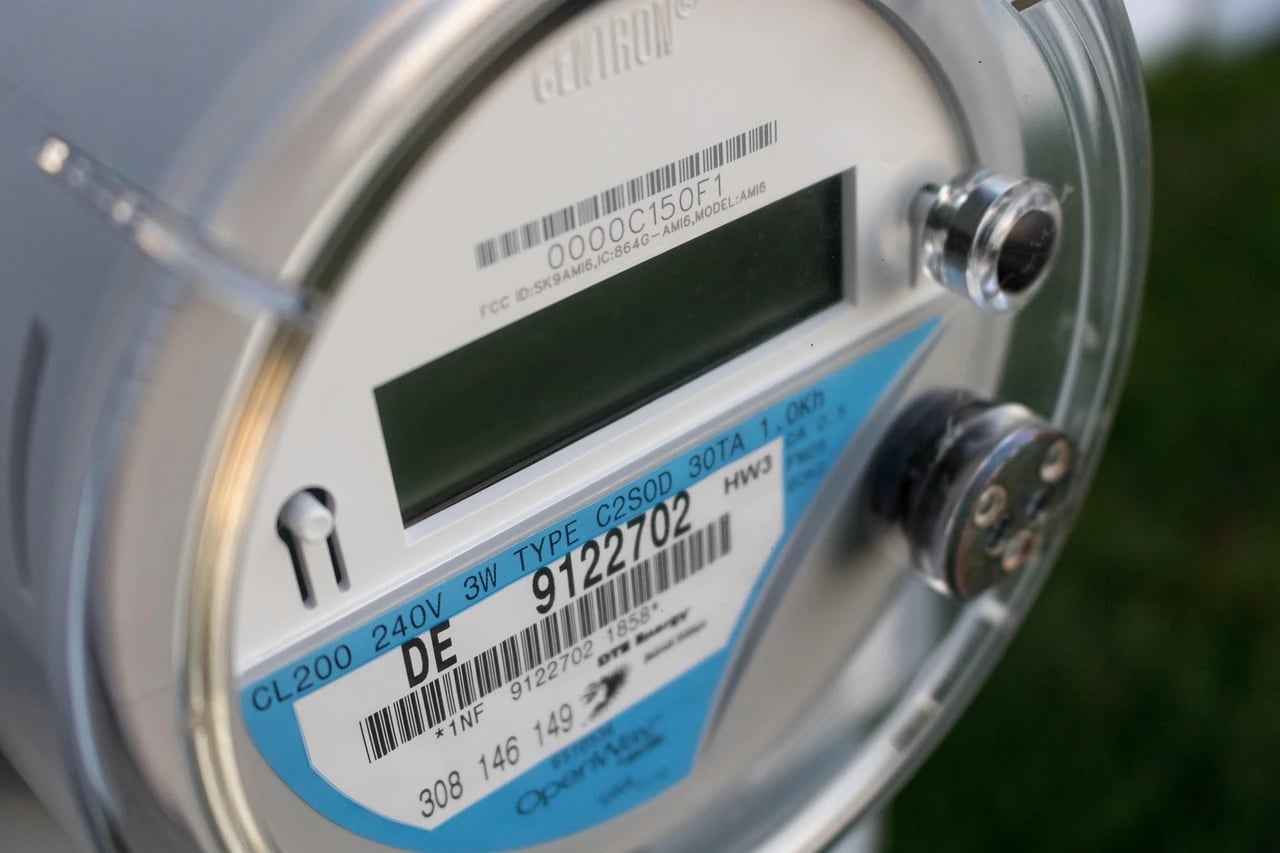
The BLS age table puts utilities, fuels, and public services at about $353 a month for households headed by someone 65 or older in 2022.
That’s a yearly spending figure turned into a monthly average, not a prediction of your next bill.
Gather the charges you place in this category and total them across the months you have records for. Divide by those months. A heating bill that stands out on its own will then sit beside the smaller bills from another season.
Compare that result with $353 if the comparison helps. More important, keep the amount you found in your budget. Using only the most recent envelope would give one month too much say over the rest of the year.
19Average Monthly Entertainment And Hobby Costs

Entertainment averaged about $223 a month in 2022 for households headed by someone 65 or older, according to BLS. It has a place in the national spending total. You don’t need to erase a theater ticket before you make an honest budget.
Look through your recurring charges and the outings you remember paying for. Write down what they cost across the year, then turn that into a monthly amount. That gives the ticket stub in your coat pocket some context.
If $223 is more than you spend, it says nothing about whether you enjoy your days. If it’s less, look at your full budget before cutting an activity you value. The point is to account for spending that belongs to your life, rather than leaving it out because it isn’t a household bill.
See more: 23 Habits of the Happiest Retirees →
18Monthly Clothing And Personal Care Costs

There are two separate lines here. For households headed by someone 65 or older, BLS recorded about $94 a month for apparel and services in 2022. Personal care products and services averaged about $59 monthly.
A month with a new coat won’t resemble a month with no clothing purchases. Check a longer stretch of your records before calling either one normal. Do the same for personal care purchases you make in batches.
Keeping the categories apart also makes the numbers easier to explain. If clothing spending jumped, you won’t have to wonder whether the difference came from another kind of purchase. Small lines deserve a place in the total. Leave enough of them out, and a larger bill gets blamed for money that went elsewhere.
17Spending Differences From 65 To 75-Plus

The BLS age groups show a change worth noticing. In 2022, households headed by someone 65 to 74 spent about $5,070 a month. Households headed by someone 75 or older spent about $4,457.
But the drop wasn’t equal across the budget. Transportation went from about $796 monthly in the younger group to about $517 in the older group. Healthcare moved the other way, from about $619 to about $642.
These are different groups of households, not a prediction of what will happen to yours on a birthday. If you’re planning ahead, change the transportation and healthcare lines separately. One falling expense does not promise that every other bill will fall with it.
16Monthly Spending Before And After 65
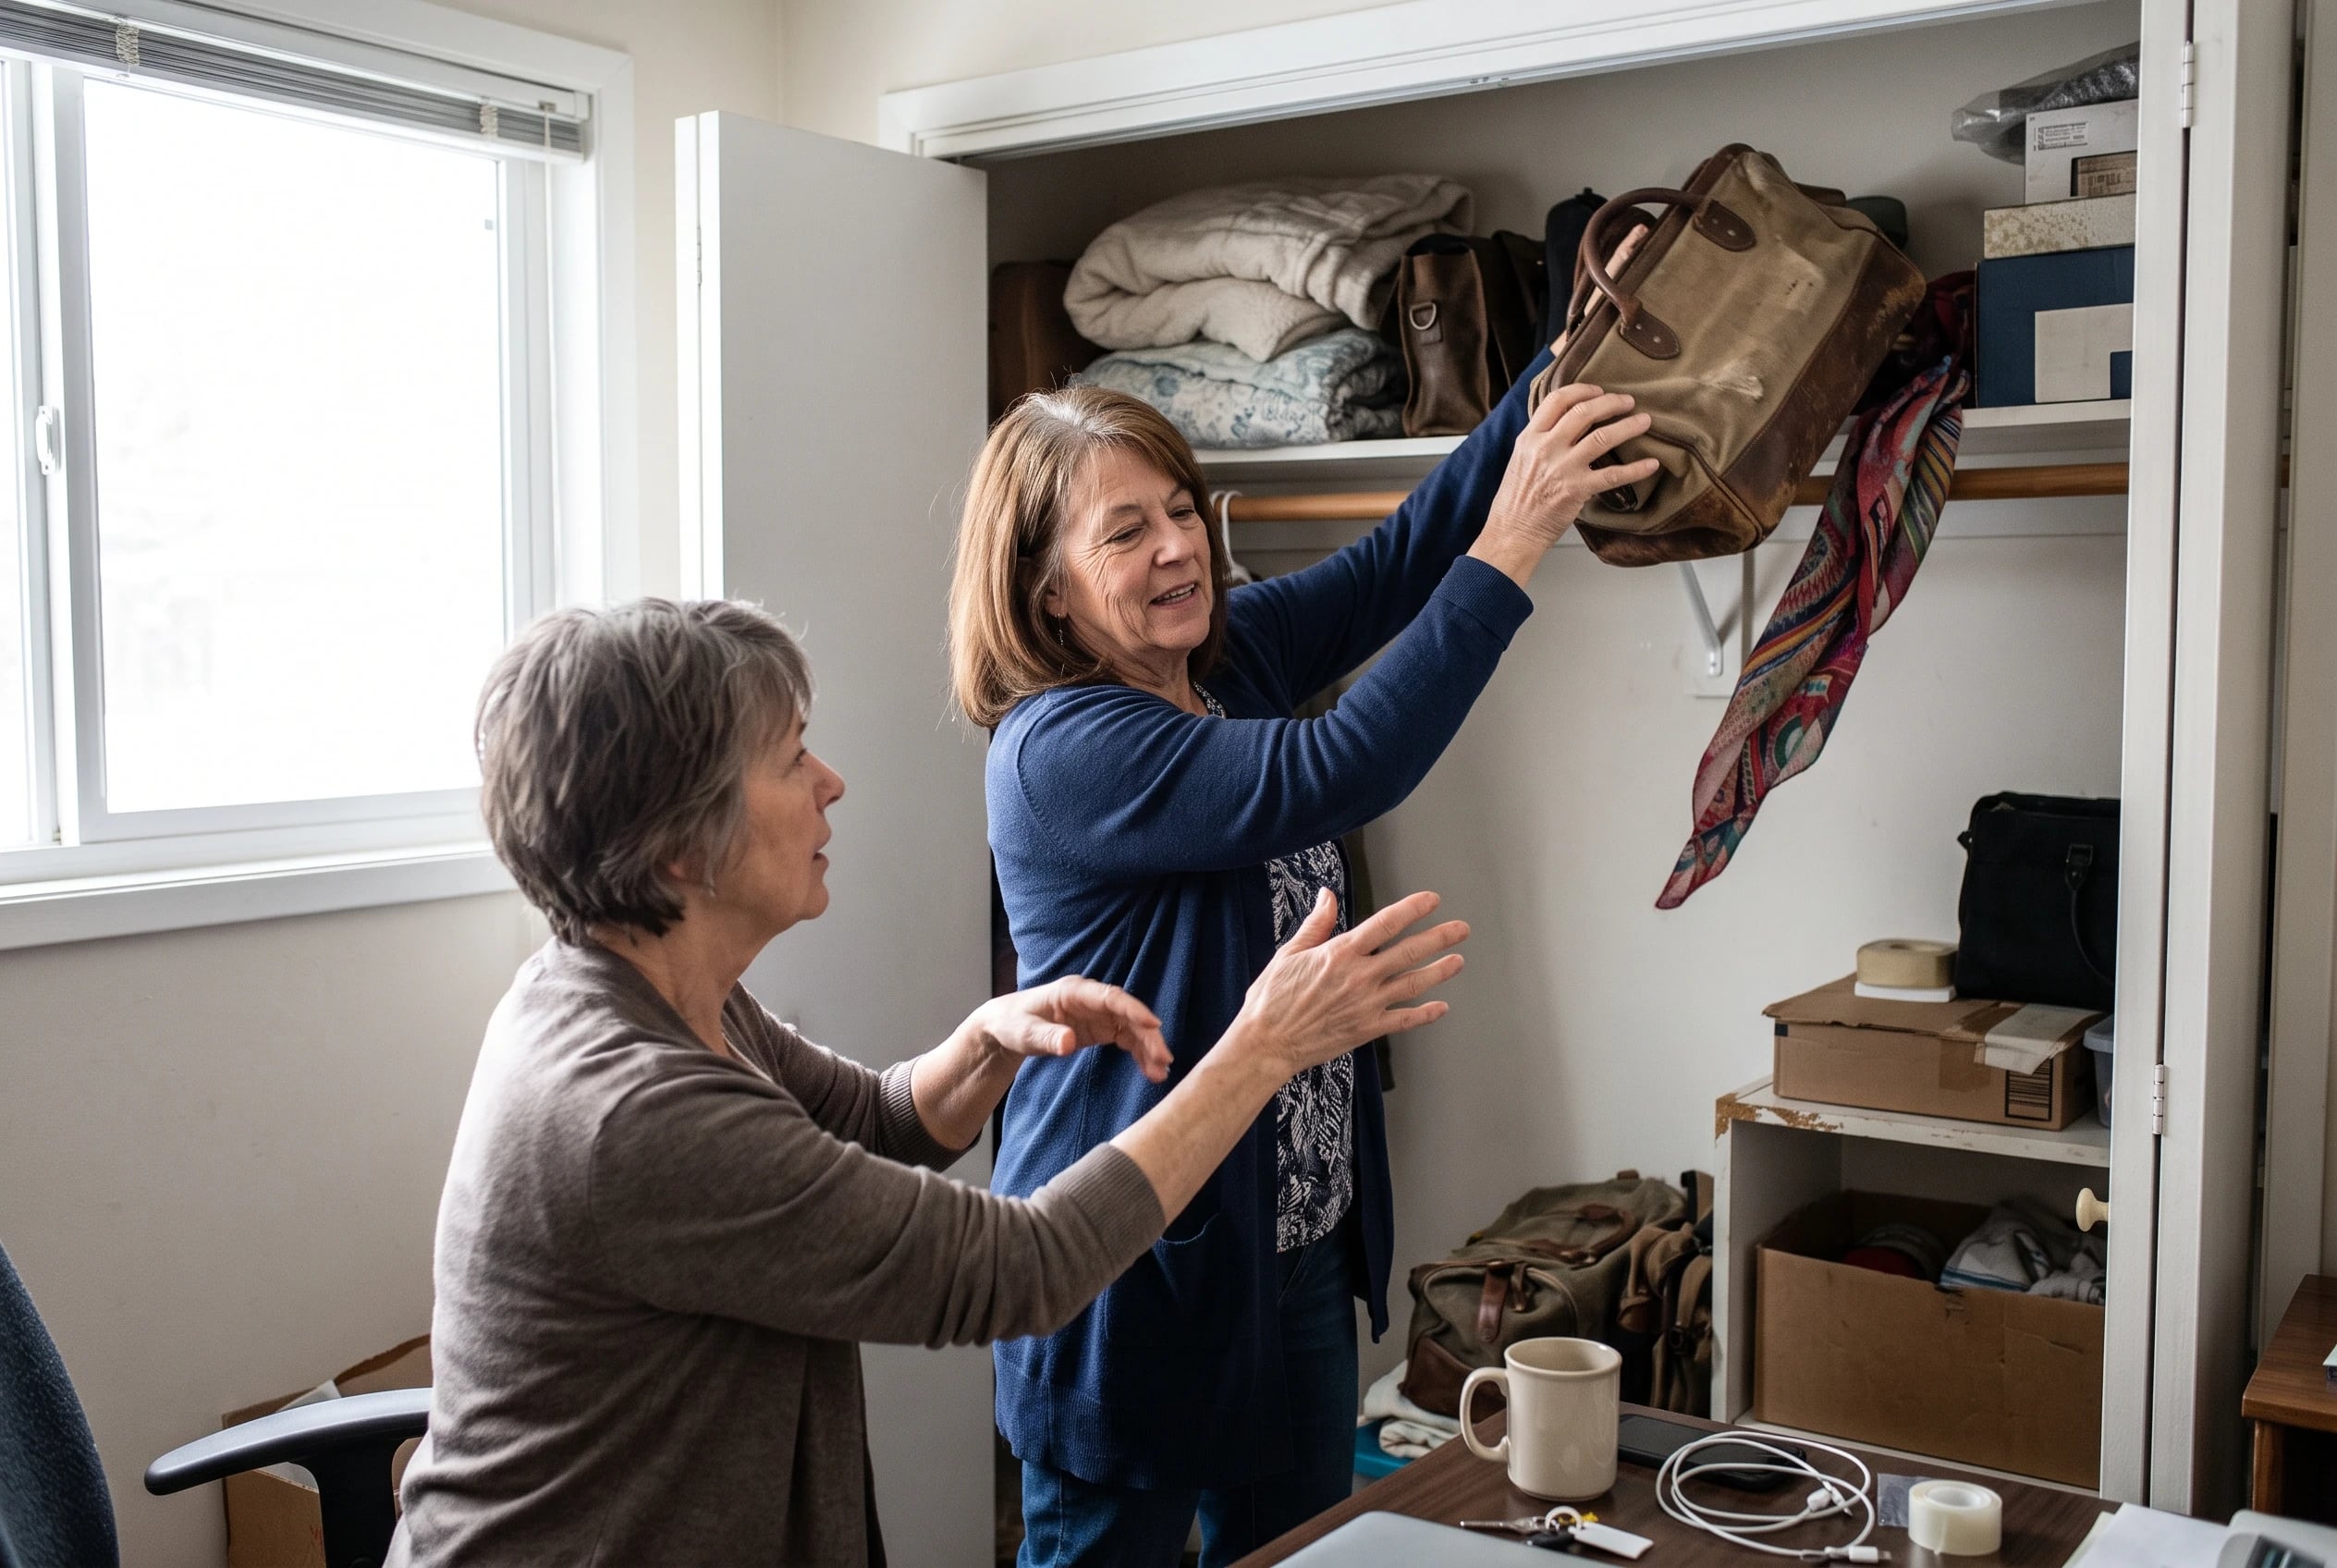
Maybe you remember what your household spent before leaving work. That’s a useful comparison, but it needs the same care as the national one.
In the 2022 BLS age table, households headed by someone 55 to 64 spent about $6,507 monthly. Those headed by someone 65 or older spent about $4,818. Across a year, the difference was about $20,000, or roughly 26%.
These figures compare age groups. They don’t follow the same households into retirement. Your spending won’t drop by 26% just because that’s the difference in the table.
Instead, put your own earlier bills beside your current ones. Identify which costs stopped, which stayed, and which arrived after work ended. If the total hasn’t fallen, that’s information you need for your plan. It isn’t proof you’re doing retirement wrong.
15Retirees Reporting Spending Under $4,000 Monthly

The $4,818 household average sits higher than many retirees say they spend. In a 2022 Employee Benefit Research Institute summary, about half of retirees reported spending under $2,000 a month.
About one-third reported spending $2,000 to $3,999. Together, that puts roughly 83% under $4,000 by self-report.
Read that alongside the BLS average, but don’t force the numbers to agree. One is what retirees reported spending. The other is an average for households grouped by age. They aren’t the same population or the same kind of estimate.
If your spending is below the BLS figure, you have company. The survey still can’t tell you whether your budget has room for the bills ahead. For that, you need your own category totals and a place for costs that arrive without warning.
14Monthly Costs For Married-Couple-Only Households

If you share a household, you probably want a number for retired couples. The BLS household-composition table gives “married couple only” households of all ages an average of about $7,111 a month in 2022.
That is not a retired-couple average. The BLS age table gives about $4,818 monthly for households headed by someone 65 or older, but it doesn’t separate retired couples from people living alone. Combining those two tables won’t produce the missing figure.
For a comparison that fits your home, add the spending of everyone whose bills you share. Then check the categories behind the total.
You can ask what a claimed “retired couple” figure includes before letting it shape a decision. If its source counts couples of every age, it cannot answer the question you meant to ask.
13Unexpected Repair And Family Expense Bills
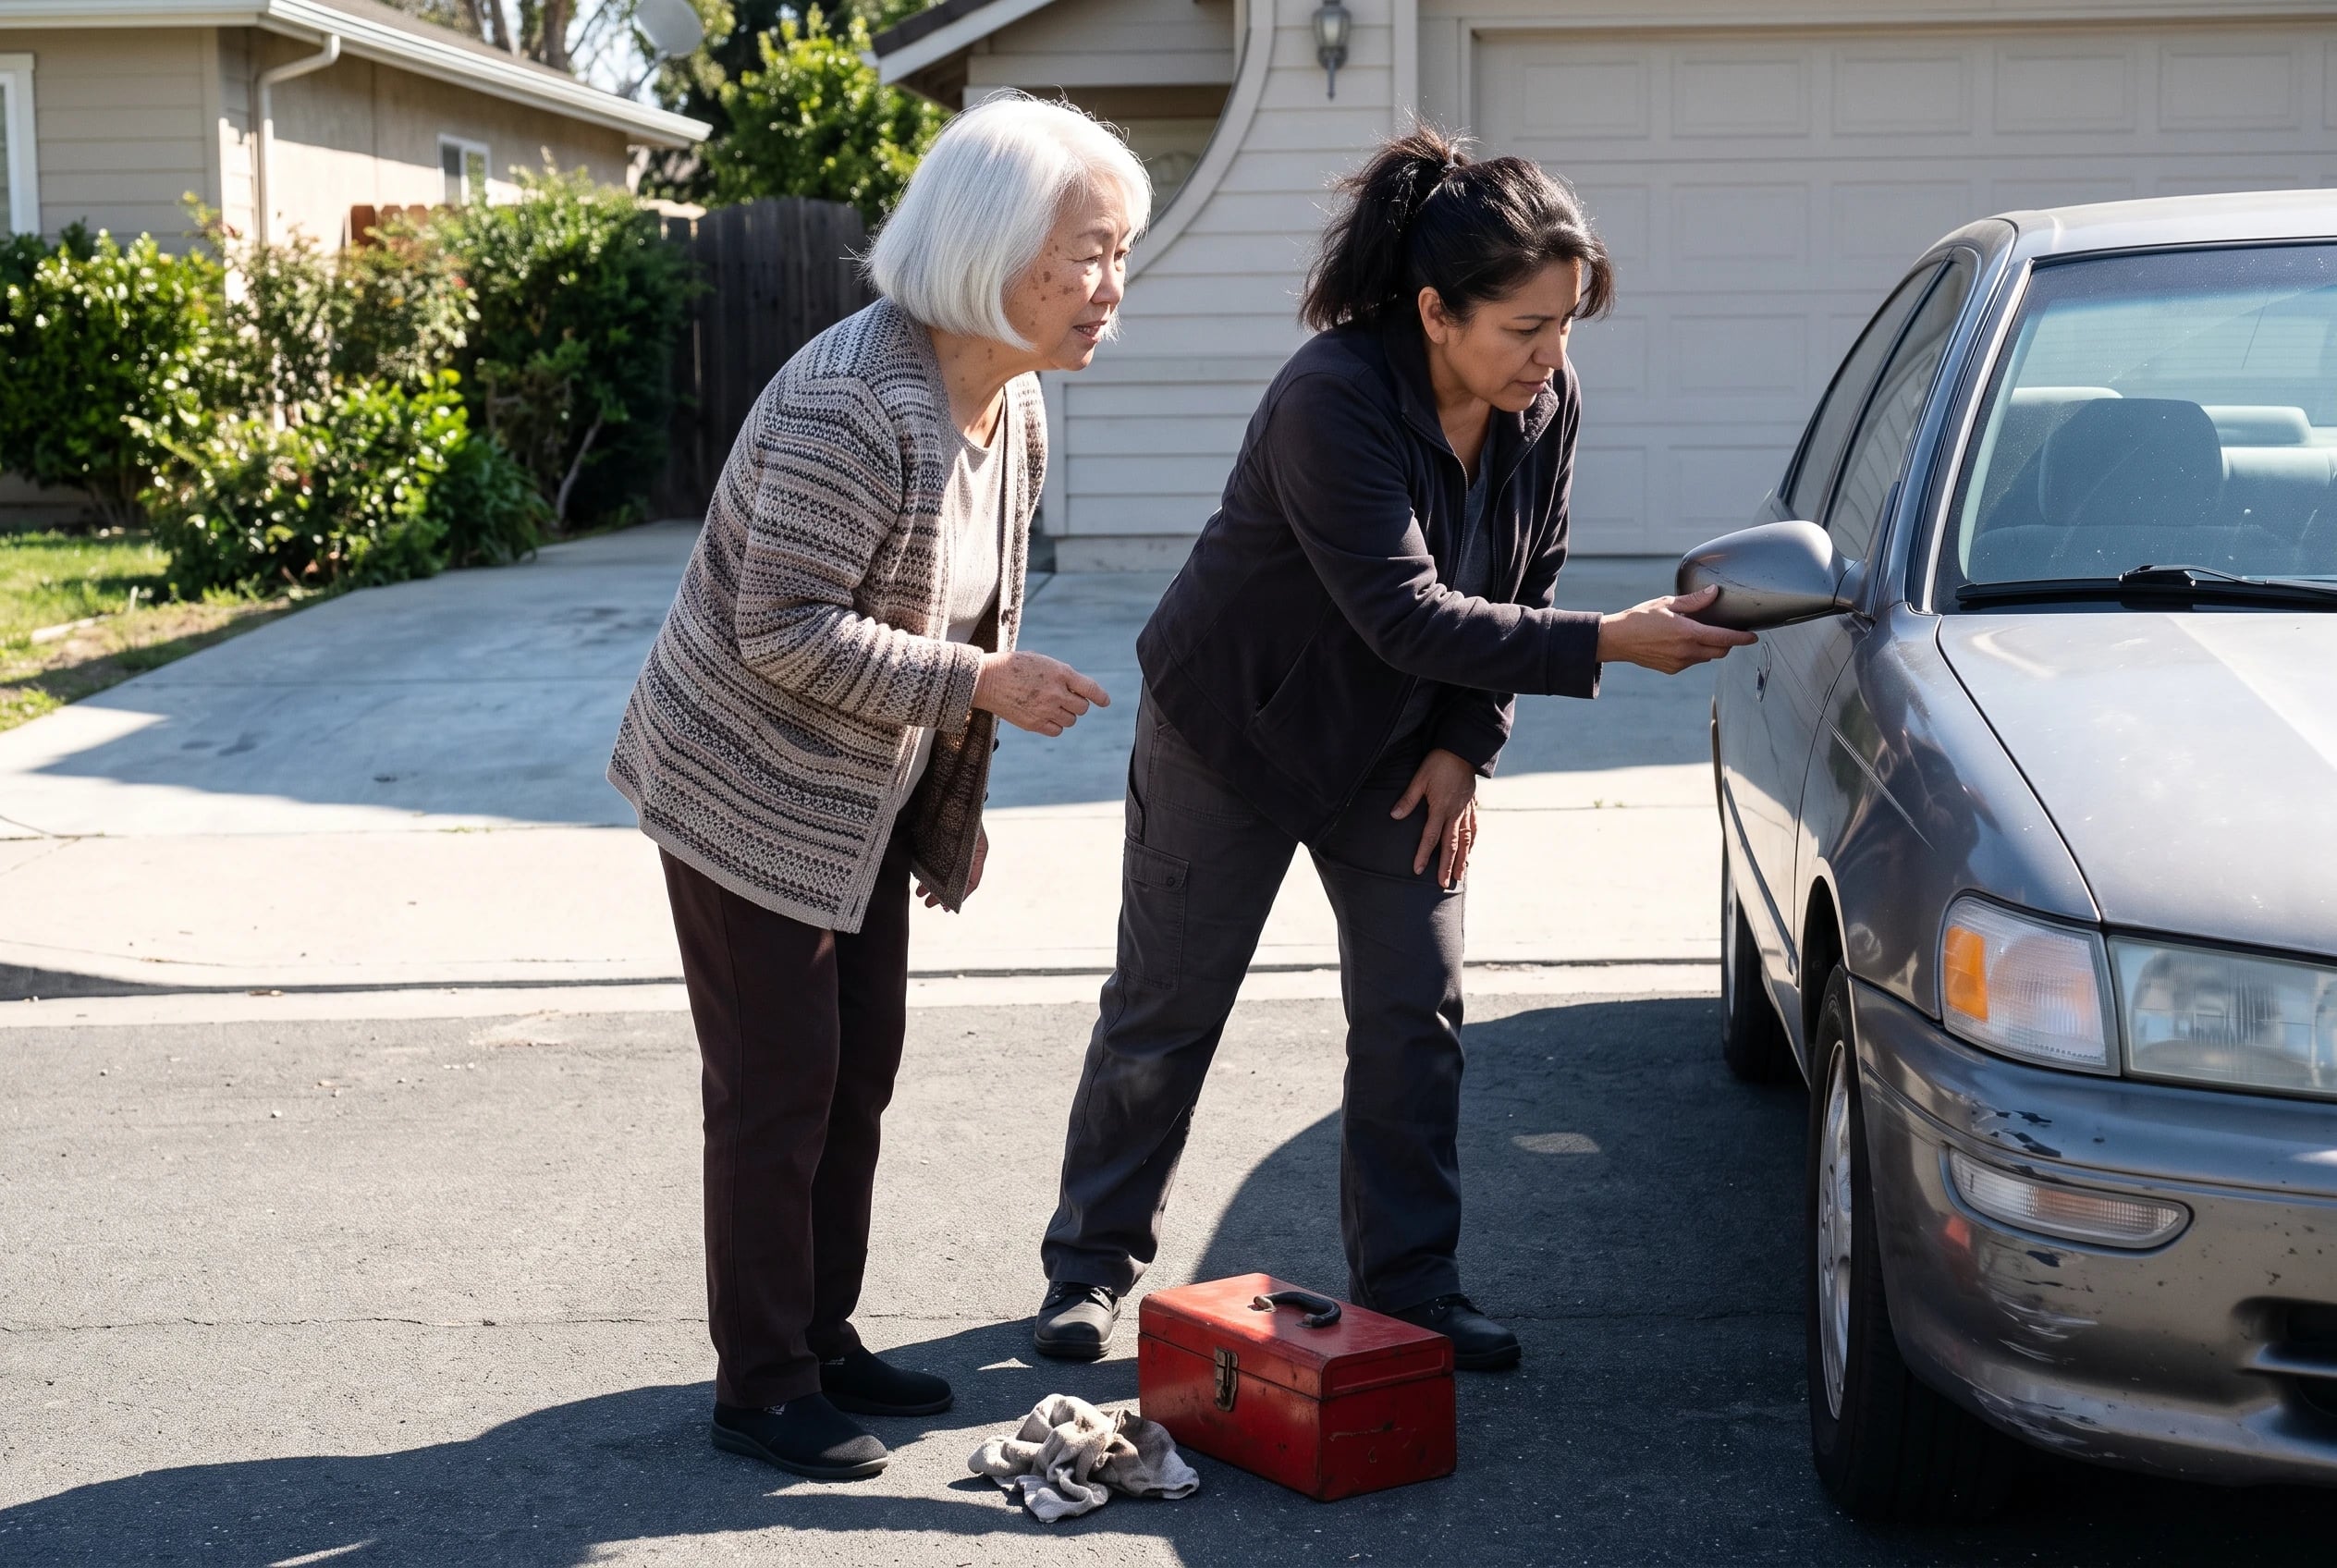
The car repair didn’t ask whether this month had room for it. That’s why an ordinary monthly total needs a second look.
The AARP Public Policy Institute reports that most retirees face unexpected expenses each year totaling about 11% of annual income.
The costs include home and auto repairs, family expenses, and out-of-pocket health or long-term care spending.
That percentage describes the reported expenses, not a monthly charge you should expect to see like clockwork. To find *your* number, look back at irregular bills from the year. Add the ones you’d have had to pay even if you’d planned a lean month. Divide that total into a monthly amount you can set aside.
A repair isn’t evidence that your everyday spending was careless. It is evidence that a budget built only from recurring bills leaves out part of living in your household.
12Local Housing Costs In Your Budget
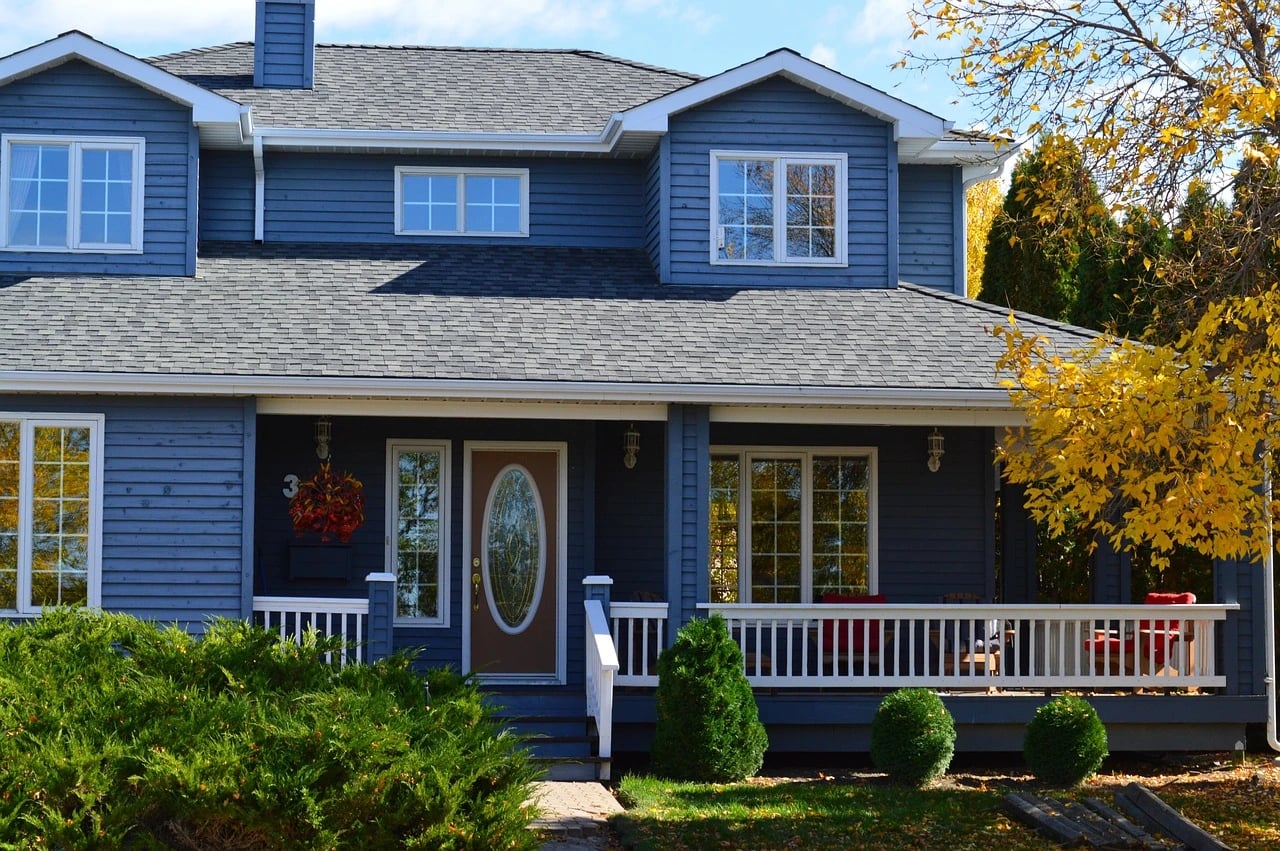
A national housing average cannot tell you what a home on your street costs. Housing accounted for 35.2% of spending among households headed by someone 65 or older in the 2022 BLS age table.
The research for this article found no single national figure that combines state living costs with a monthly retiree spending breakdown. So there’s no sound state-by-state retiree number to put next to yours here.
Use the national share to ask a local question instead: what portion of *your* monthly spending goes to housing? Divide your housing total by everything you spend in the month.
If that share is higher than 35.2%, look at the actual bills before deciding what to change. Your address is real; a made-up local benchmark wouldn’t help you.
11Full Monthly Budget Using BLS Averages

Here is what the 2022 BLS figures look like when you lay the household categories together. These are rounded monthly averages for households headed by someone 65 or older, displayed for reading rather than for copying into your own budget.
| Spending category | Monthly average | |---|---:| | Housing | About $1,697 | | Transportation | About $681 | | Healthcare | About $628 | | Food | About $609 | | Utilities, fuels, and public services | About $353 | | Entertainment | About $223 | | Apparel and services | About $94 | | Personal care products and services | About $59 | | Cash contributions | About $370 | | Personal insurance and pensions | About $274 |
Total spending across all categories was about $4,818 monthly. The displayed lines are not a complete itemization of that total. Adding them won’t reach $4,818 exactly.
Cash contributions are easy to overlook when you picture “household expenses.” Personal insurance and pensions also appear in the BLS spending table. Notice both lines now. Later, when you build your own total, record the payments that actually apply to you.
10The National Average As A Daily Number

About $4,818 a month works out to roughly $159 a day, using the 2022 BLS average. It’s a quick way to picture the scale of the total, not an instruction to spend $159 every day.
Housing or healthcare alone can use up several days’ worth at once. So don’t treat a large bill as a broken daily limit. The test works better in reverse: total what you actually spent for a month, then turn *your* total into a daily average.
If the result makes you uneasy, go back to categories before cutting purchases. You need to know whether the gap came from a regular bill, an irregular repair, or small charges that didn’t feel important when you made them.
9A Retired Couple On $3,000 Monthly

Can a retired couple live on $3,000 a month? The 2022 BLS average for households headed by someone 65 or older was about $4,818 monthly, well above that amount. But the age-based average cannot tell you what a particular couple needs.
The EBRI summary puts roughly 83% of retirees under $4,000 in self-reported monthly spending. It does not tell us what share of retired couples live on $3,000.
If $3,000 is the amount available to your household, write down the bills that must fit inside it. Start with housing, healthcare, food, and transportation. Then include the costs that arrive only partway through the year.
Those payments give you a test the national figures cannot provide. A survey bracket under $4,000 does not tell you who spends $3,000, or what their homes and health cost.
8The Undefined $1,000 Monthly Retirement Rule

You’ve heard someone mention a “$1,000 a month rule.” No standard by that name was defined in the official or research sources reviewed here. The BLS Consumer Expenditure Survey tracks spending; it doesn’t define this rule.
Before using the phrase in a decision, ask what the speaker means by it.
Does $1,000 refer to spending, income, savings, or the gap between income and bills? Without an answer, the phrase tells you nothing about whether your budget works. Put your real spending next to your real income instead. If someone recommends the rule, ask them to show the calculation behind it.
7The Missing $1,000,000 Retiree Savings Share

A claim about how many people retire with $1,000,000 saved sounds precise. The research reviewed for this article found no current, nationally representative percentage that directly answers it. The BLS spending tables track expenditures; they do not give that savings share.
Before you use a percentage from a headline, check the group it counts. Retirees or all adults? Individuals or households? Savings alone or total assets?
If those answers aren’t clear, leave the claim out of your plans. Your own monthly records answer a different question: what comes in, what goes out, and what gap remains. A stranger’s claimed savings milestone cannot do that work.
6Housing And The Next Largest Expense

Housing stands first in the 2022 BLS figures for households headed by someone 65 or older. It accounted for 35.2% of total spending. Transportation came next at 14.1%, with healthcare close behind at 13.0%.
That makes transportation the second-largest category in this table, though healthcare deserves attention in a personal budget. In your home, their order could be reversed.
Rank your own categories before trying to trim the small ones. If housing uses the largest share, saving a little on entertainment won’t change the shape of your budget.
If healthcare outruns transportation, put it second on your list. The national ranking gives you a place to look; your ranking shows where the money actually goes.
5Healthcare Spending At 75 And Older

Overall household spending was lower in the older BLS age group. Healthcare spending wasn’t. Households headed by someone 65 to 74 averaged about $7,422 a year on healthcare in 2022. For those headed by someone 75 or older, BLS recorded about $7,708.
That’s a difference between groups, not a bill that arrives when you turn 75. It says nothing certain about what you personally will pay.
If you’re testing a future budget, don’t reduce every category by the same amount. Keep healthcare visible as its own line. Compare your recent payments with older ones, then check whether the amount you’ve allowed still fits. A past bill gives you something firmer to work with than a birthday assumption.
4The Newer Overall Household Spending Figure

You’ll see a newer national number in the BLS 2024 report: about $6,545 monthly for all consumer units. Food averaged about $847 a month, including about $519 at home and $329 away from home.
These figures cover all ages. The older-household category figures used for the main comparison here come from 2022. Don’t replace one with the other because the all-ages report has a newer date.
When a spending headline catches your eye, look for two details before comparing it with your own bill: the survey year and who was counted. A number without those details can make a grocery trip feel unusual for no good reason.
3Lean Spending Beside The National Average

“Lean” sounds like a judgment until you put a number beside it. In the 2022 EBRI summary, about half of retirees reported spending under $2,000 a month. The 2022 BLS average for households headed by someone 65 or older was about $4,818.
Neither figure defines a comfortable life. They come from different sources and measure different groups in different ways. Calling one “bare-bones” and the other “comfortable” would claim more than the numbers show.
If your total is low, check what it buys: your home, food, care, transportation, and room for irregular bills. If it’s high, look at where the money goes before deciding it’s excessive. The label won’t tell you whether this month worked. The category list will.
2Your Category-By-Category Spending Checklist

Before you calculate one grand total, give every charge a home. The BLS age table supplies these labels: housing, transportation, healthcare, food, utilities, entertainment, apparel, personal care, cash contributions, and personal insurance and pensions.
Split food between home and away if that helps you spot a pattern. In the 2022 averages, those amounts were about $400 and $209 monthly. Use your own transactions, not the averages, to fill each line.
A category doesn’t have to be large to count. If you sent money to family, record it under the line that describes it. If a charge comes only a few times a year, turn it into a monthly amount. By the time you add everything, you’ll know what’s behind your total.
1Your Blank Monthly Budget Worksheet
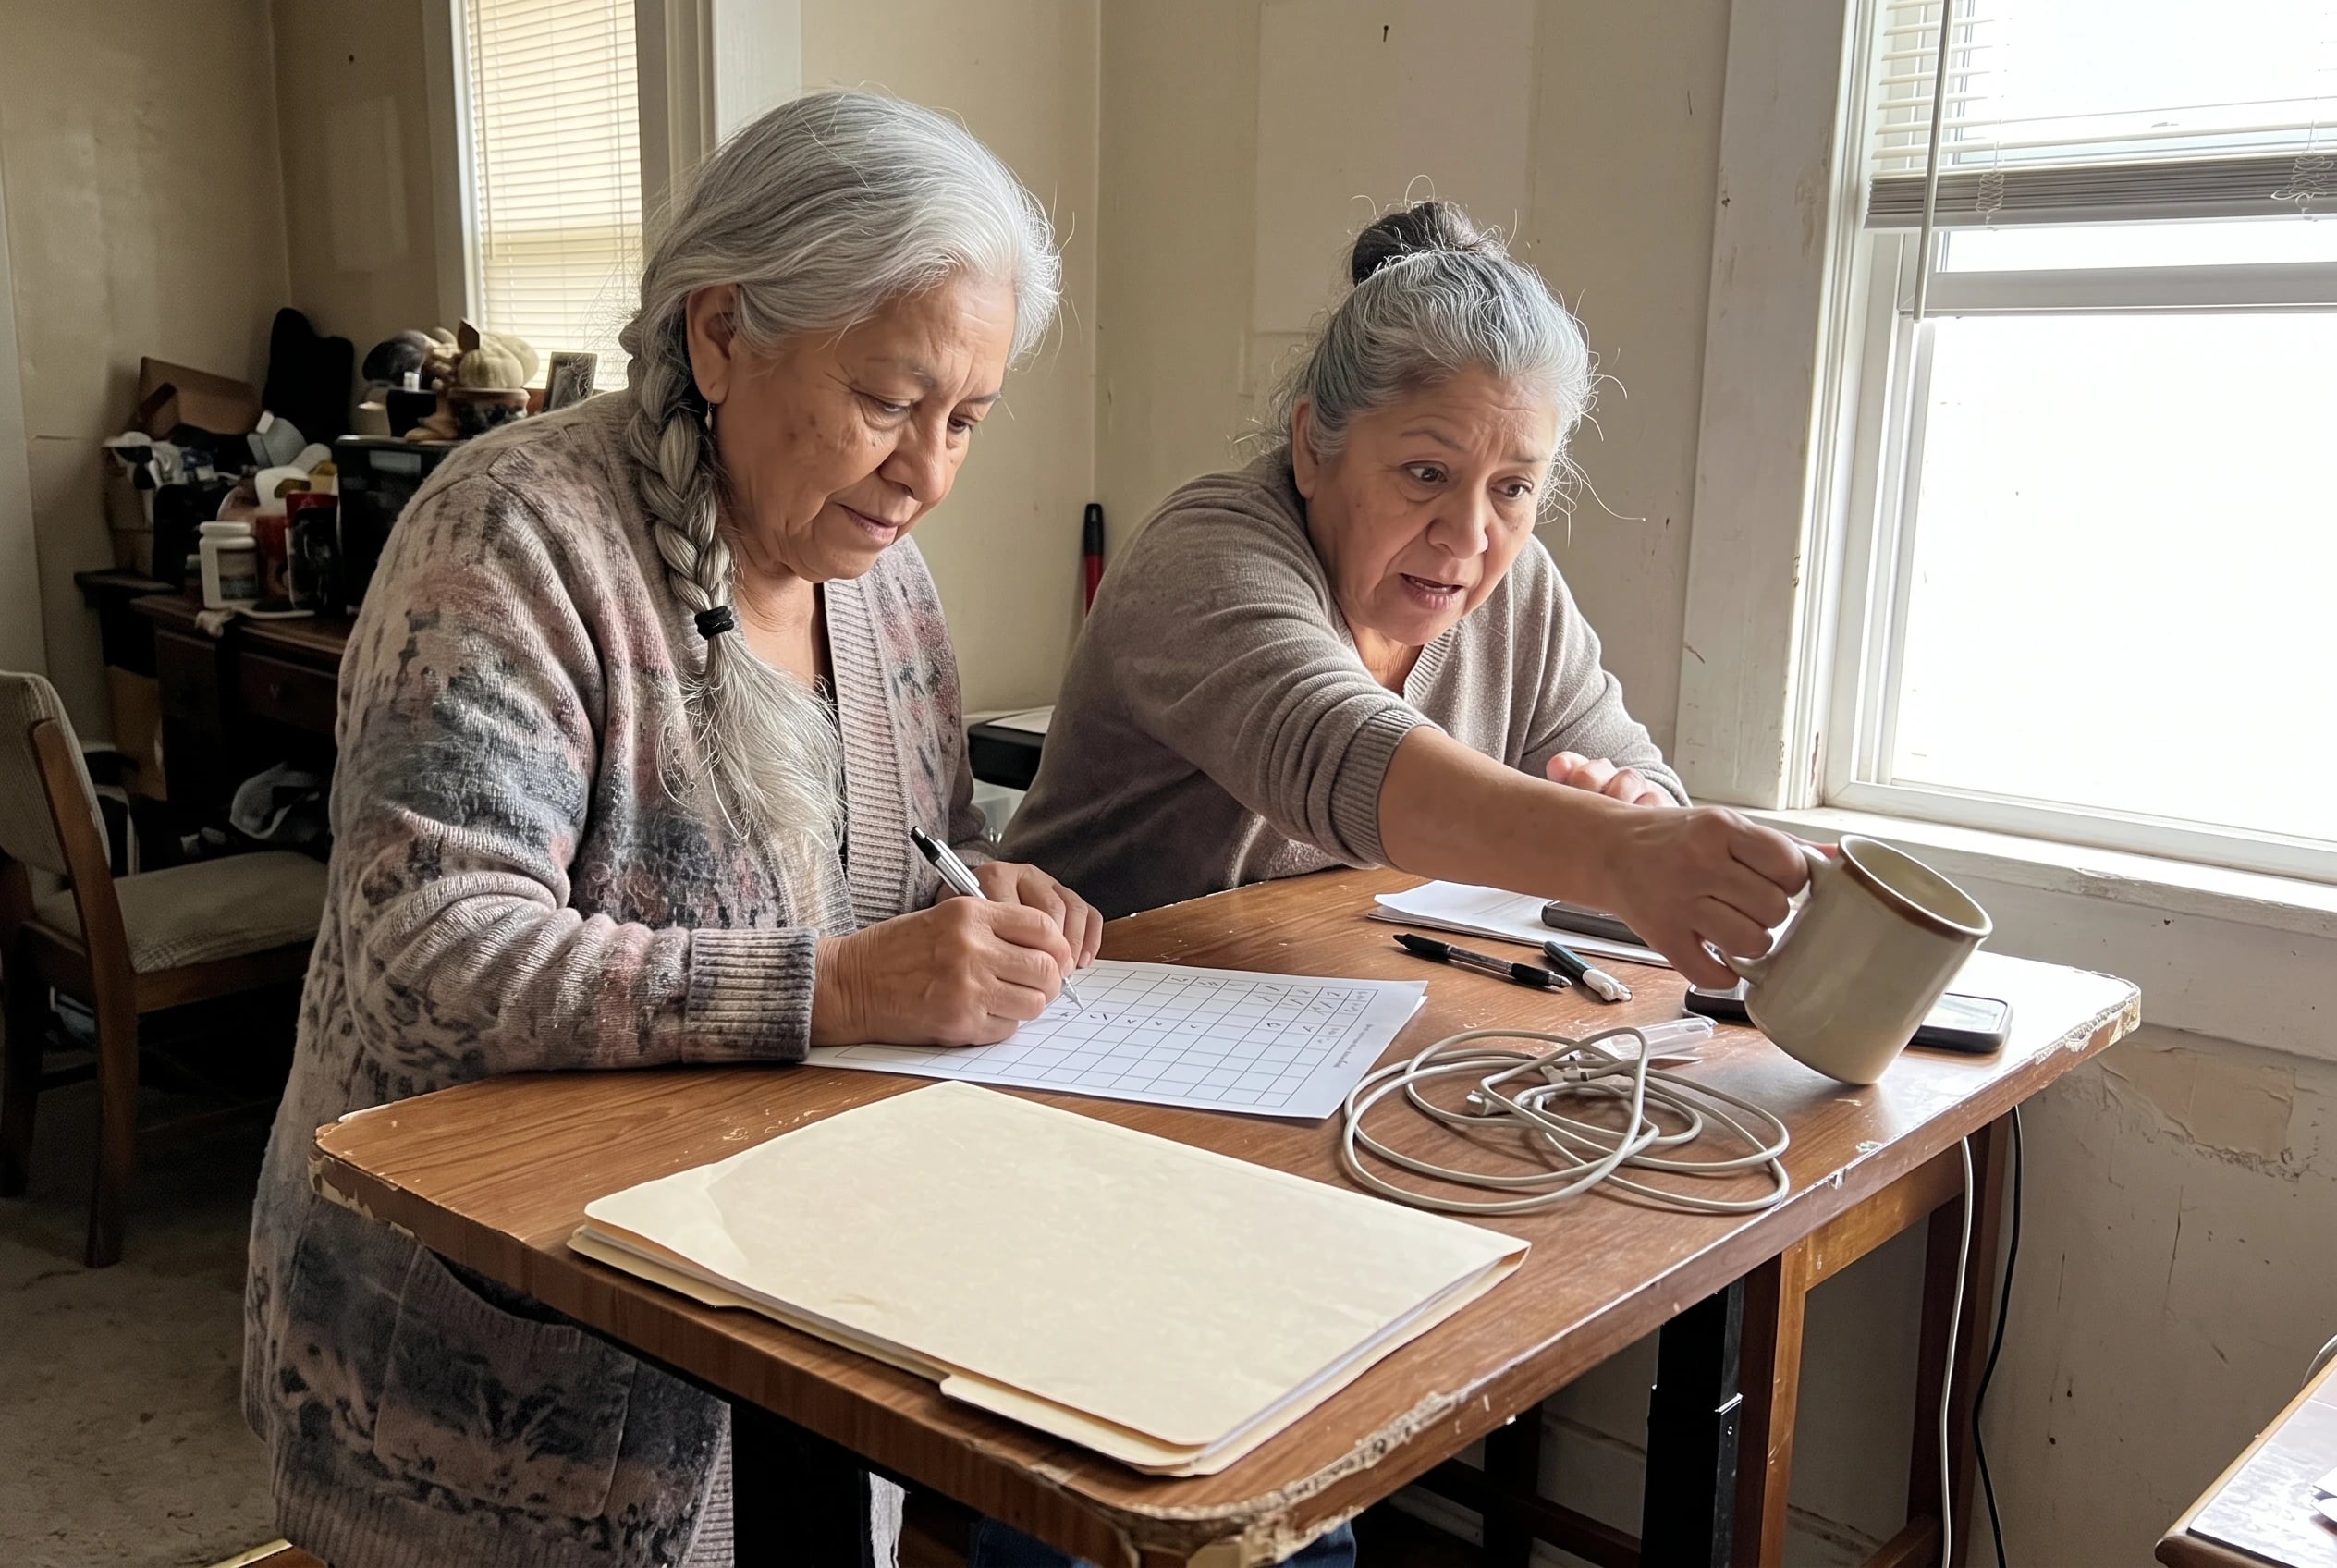
The national figures have done their job. Now leave them off the page and make one column that belongs entirely to you. This worksheet is for your actual spending, including charges that had no obvious place in the sample budget above.
| Your category | Your monthly amount | |---|---:| | Housing | ______ | | Transportation | ______ | | Healthcare | ______ | | Food at home | ______ | | Food away from home | ______ | | Utilities, fuels, and public services | ______ | | Entertainment | ______ | | Apparel and services | ______ | | Personal care products and services | ______ | | Cash contributions | ______ | | Personal insurance and pensions | ______ | | Other spending | ______ | | Total spending | ______ |
Fill it from your records. For a bill that arrives only occasionally, divide what you paid by the months it covered. Write that monthly share on the line where it belongs. Put any charge you cannot place under “other spending” rather than dropping it.
Add the column without trying to reach a national average. If the total unsettles you, circle the lines you want to check against an actual bill. That gives you a next step smaller than “fix the budget” and far more useful.
The bottom line
A national average gives you a reference point. It won’t tell you whether your own spending is too high or too low.
The well-prepared version of you has the monthly charges in categories, the occasional bills accounted for, and a total drawn from your own records. She doesn’t need to make the total resemble anyone else’s.
Which line on your worksheet would you most want to check against an actual bill?
Up next
22 Things That Change on Your Taxes the Year You Retire
A final paycheck, a pension deposit, and an IRA withdrawal reach the same return, but each arrives with different tax paperwork.
Read the list →


Reader quiz
Did you catch the details?
5 questions from this article.
How does this item suggest tracking food spending across a month?
Questions people also ask
What are the top two expenses for retirees?
Housing was the largest category for households headed by someone 65 or older, at 35.2% of spending in 2022. Transportation was second at 14.1%, followed closely by healthcare at 13.0%, according to the BLS age table.
Can a retired couple live on $3,000 a month?
Some households spend at or below $3,000. But the 2022 BLS average for households headed by someone 65 or older was about $4,818 monthly. The EBRI summary puts roughly 83% of retirees under $4,000 by self-report. It does not give a retired-couple figure for $3,000. Check your housing, healthcare, and other actual bills against that amount.
What is the $1,000 a month rule for retirees?
No standard “$1,000 a month rule” was defined in the official or research sources reviewed here, including the BLS Consumer Expenditure Survey. Ask what the amount refers to before using the phrase in a decision.
What percentage of people retire with $1,000,000?
No current nationally representative percentage directly answering that question was found in the sources reviewed here. The BLS expenditure tables report spending, not the share of retirees with $1,000,000 saved. Check whom any claimed figure counts before comparing it with your savings.
How much does the average retired couple spend per month?
BLS does not give a separate national average for retired couples. Its 2022 age table shows about $4,818 monthly for households headed by someone 65 or older. Its married-couple-only table shows about $7,111 monthly across all ages, so that figure is not specific to retirees.
Did any of these feel familiar?
Know someone who needs this?
 Prime Journal · Free printable
The Everyday Money Checklist
- Your upcoming bills and automatic payments stay in view.
- Your account access and family loans have clear boundaries.
- Your Medicare questions are ready before you call.

Free printable: The Everyday Money Checklist. Enter your email and it is yours.
Sources cited in this article
This article links to 7 outside sources, listed here so you can read them yourself.
- 2022 Bureau of Labor Statistics data for households headed by someone age 65 or older www.bls.gov/cex/tables/calendar-year/mean-item-share-average-standard-error/…
- 2022 Employee Benefit Research Institute summary www.ebri.org/docs/default-source/by-the-numbers/ebri_spending_facts-and-figu…
- BLS household-composition table www.bls.gov/cex/tables/calendar-year/mean-item-share-average-standard-error/…
- AARP Public Policy Institute www.aarp.org/pri/topics/work-finances-retirement/financial-security-retireme…
- BLS Consumer Expenditure Survey www.bls.gov/cex
- BLS spending tables www.bls.gov/cex/tables.htm
- BLS 2024 report www.bls.gov/opub/reports/consumer-expenditures/2024/home.htm
Linda Cho, CFP®
Money Editor
Linda is a certified financial planner who spent two decades advising retirees before joining Prime Journal.
More from Linda Cho